Turn enterprise data into decisions that work.
Imagine your company could tell you every morning what has changed since yesterday — where cash is tied up, where a risk is forming, which opportunity is being left on the table. And why. Granalis builds that picture from the data you already have, and shows you which decision will make a difference now. Every recommendation with evidence. Every impact measured.
Recommendation with evidence and business case — you approve.
Case assembled, workflow created, stakeholders informed.
Alert, parameter, order stop — within your rules.
Your company sends signals every day — but nobody sees them in context.
Everything you would need to know is already there — just never in one place. The numbers sit in the ERP, receivables in accounting, quotes in the CRM, terms in contracts, reports in PDFs. Every system knows its slice. What happens between the slices — stock building up, payment terms drifting, quotes left untouched — nobody notices in time.
Analyses are snapshots
An assessment, a consultant’s report, a quarterly review: they show one state. Three months later it is history — and nobody can say what has changed since.
Data without connection
ERP, accounting, CRM, warehouse and documents don’t know each other. The same supplier, customer or item has a different name everywhere. Without a shared model, every cause remains a guess.
Recommendations without proof
Actions get decided — but rarely measured afterwards. Whether a decision actually moved cash, margin or risk stays open. So neither the company nor its tools learn.
Generative AI alone doesn’t solve this: it produces plausible answers — plausibility is not reliability. Decisions need connected data, evidence and proof of their impact.
A system that continuously understands your company — not a one-off analysis.
Granalis builds a living model of your company from your data and works in four steps: connect, understand, observe, act. The result is not a dashboard but evidenced recommendations — with measured impact.
Connect
Structured systems and unstructured documents — both are connected: via export or interface, without an infrastructure project. Contracts, reports, scans and spreadsheets are read just as they arrive. Nothing is retyped, every source stays versioned.
Understand
An ontology turns many systems into one model: customer, item, order, invoice, supplier, stock, contract — defined once, identical everywhere. Identity resolution recognises that three spellings are one supplier. Every value keeps its origin: system, document, page, position.
Observe
Granalis doesn’t wait for the next analysis. It knows normal states and seasonality, detects deviations and explains what is behind them. Every statement carries an evidence level — measured, benchmark, expert assumption or AI estimate. Whatever isn’t consistently evidenced is decided by a human.
| Insight | Recommendation | Impact (expected) | Evidence |
|---|---|---|---|
| Receivables: DSO +12 days above normal | Adjust dunning for customer group B | ≈ €900k liquidity | Accounting · open items · 24 months |
| Stock without movement > 180 days | Sell-off · stop ordering 38 items | ≈ €780k inventory | ERP · stock list · movement history |
| Safety stock above demand | Lower planning parameters for 14 items | ≈ €340k inventory | ERP · demand history · lead times |
| 19 large quotes untouched > 30 days | Follow up · sales region South | Pipeline risk | CRM · quote list · activities |
Act
Insight becomes recommendation — with business case, expected impact and confidence. After the decision, Granalis measures what actually happened. That is what makes it a learning system: after a year it knows which actions work in your company — and which don’t. Your data remains yours: full export anytime.
History instead of snapshots
Granalis stores states over time. After one analysis it knows a state — after years it knows normal values, seasonality, causes and the impact of earlier actions. That yields benchmarks no single report can provide.
Connected instead of scattered
A configurable ontology turns many systems into one model: synonyms merged, units converted, definitions unified. Structured data and documents land in the same enterprise graph: matched to master data, duplicates detected, contradictions flagged — up to a reliable golden record.
Evidenced, not claimed — AI checks AI
Every insight must be anchored to its source: system, document, page, position. Multiple AI instances check each other; every statement carries confidence and an evidence level. Whatever isn’t consistently evidenced is decided by a human. Built as architecture, not claimed as a promise.
Your data stays yours
Operated as a managed service in European data centers: strict tenant isolation, encryption, GDPR-compliant. Your data is never used for model training. Dedicated environments on request.
Every statement auditable
Not just “which system” — which record, which page, which revision, who verified it, who decided. Traceable back to the source, even years later.
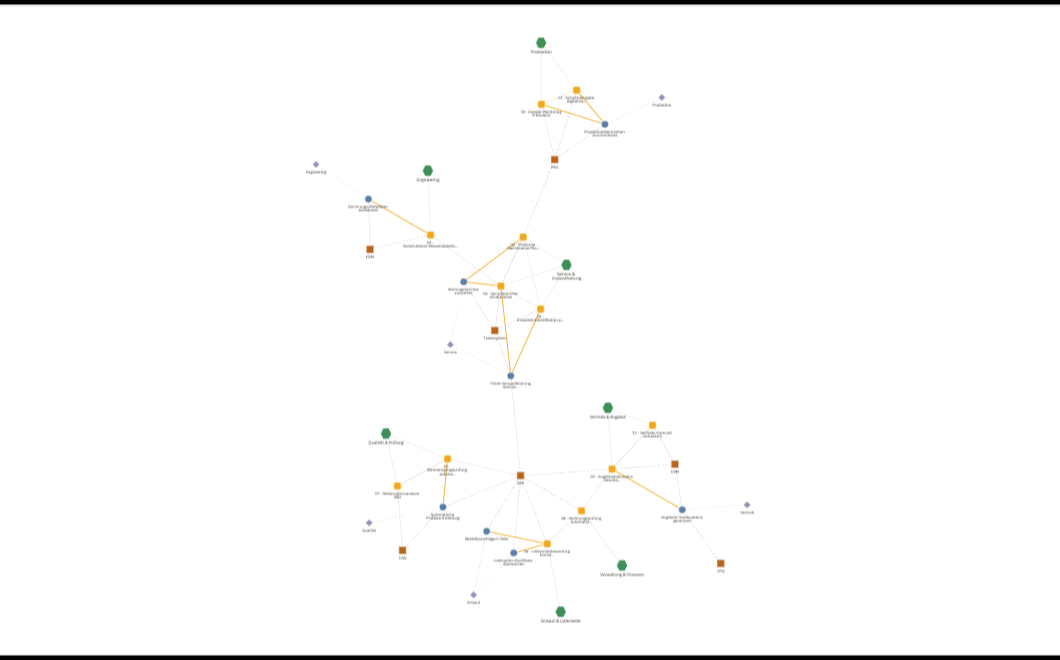
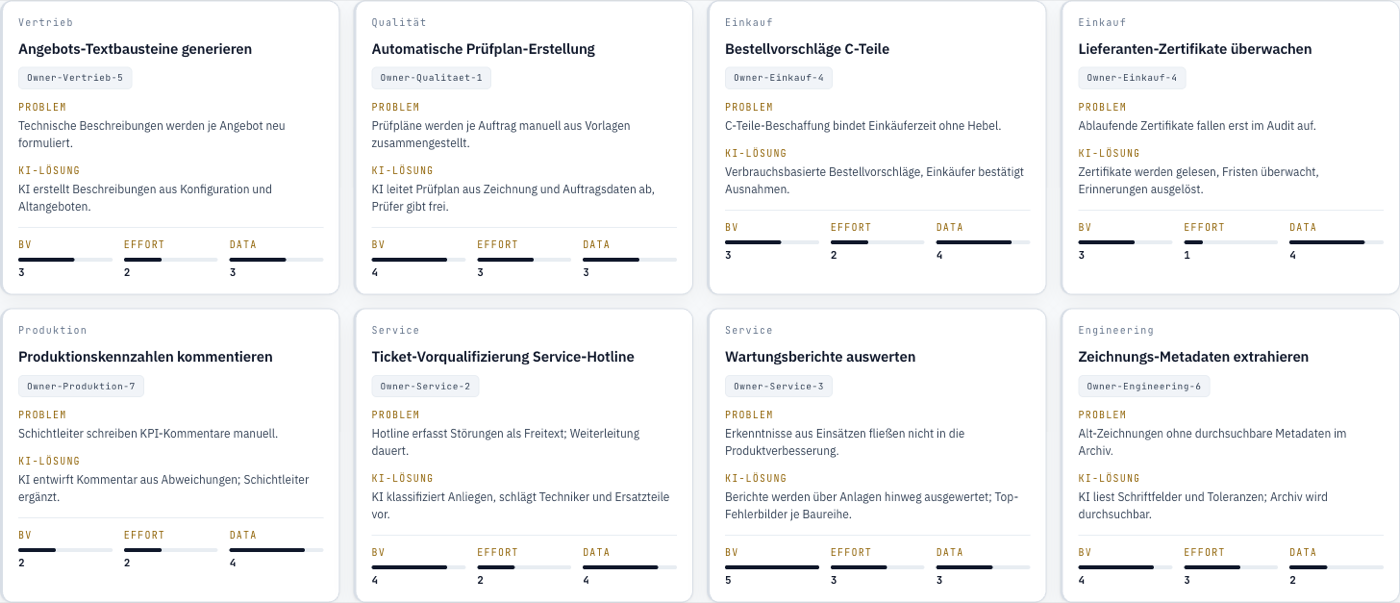
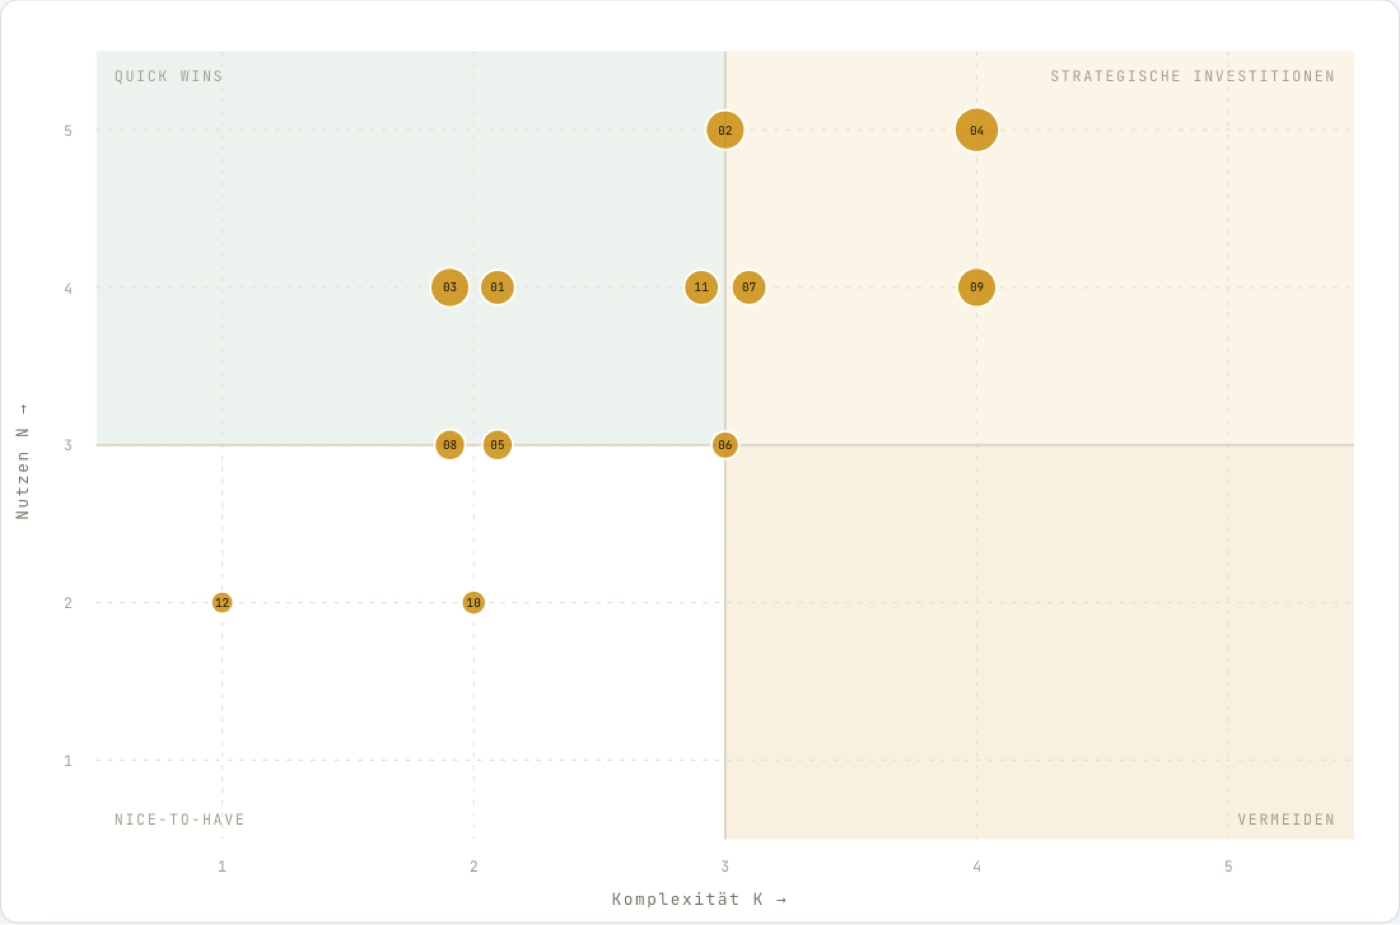
Via — Latin for the way. Via makes visible how your company’s current projects and initiatives contribute to the strategic goal — and where they overlap or run against it. From dependencies, potentials, effort and readiness, Via derives the reliable project roadmap that takes your company from A to B. And it identifies the AI potentials across your organization — short, medium and long term — on the way to becoming an AI-driven company. Every initiative with a business case, an evidence level and — after execution — its actually realised impact. Every statement with its source.
Summa — Latin for the sum, the complete work. Summa brings together what is reported in pieces: dozens, often 150+ reports per quarter — from target funds, portfolio companies or subsidiaries, in any language and any layout. KPIs are normalized through the shared ontology — a capital call is a capital call, whatever it is named — consolidated, and composed into your own uniform report. Every number in the result points to its source in the original report — audit-proof down to the last line. And quarter after quarter the history grows: deviations, trends and benchmarks per holding.
Specto — Latin for I watch. Specto is the platform’s continuous observation: it knows your company’s normal states and reports what deviates — stock building up, receivables tipping, terms drifting, deadlines expiring. External signals meet your model and become prioritised alerts with cause and evidence. Granalis doesn’t wait for someone to start an analysis.
Fabrica — Latin for the workshop. Fabrica is the engine, not the product: it reads documents at industrial scale — contracts, reports, certificates, datasheets, in hundreds of layouts, exactly as suppliers, customers and authorities deliver them. Every value is detected, normalised and linked with your master data; tables and characteristic curves are read as well. What leaves the workshop is raw material for Via, Summa and Specto: structured, evidenced, connected.
The shared foundation of all products: ontology, identity resolution, enterprise graph, history, provenance, benchmarks, recommendation and impact measurement. Via, Summa and Specto use the same entities, the same evidence, the same history — every statement with evidence.
What you buy is not AI — it is impact.
Ontology, graph and evidence are the reasons Granalis works. What you buy is something else: cash, margin, cost and risk — measurably moved. The value grows in four stages, and each stage is measurable on its own.
Transparency
Insight
Decision
Impact
Control stays with you: every action starts as a suggestion. How far Granalis acts on its own is set by your rules — not by the model.
Three entry points — not a platform promise.
Granalis is introduced through one bounded, measurable case — not as a major project. We deliberately start with a few use cases where the value can be expressed clearly in euros:
From project portfolio to a reliable roadmap
Documents, workshops and systems flow into a model of initiatives, use cases and dependencies. Via evaluates value, readiness and business case, detects conflicts and duplicated effort — and derives the roadmap. Once started, it measures what the initiatives actually deliver.
Consolidating recurring reporting
Investment firms, holdings, family offices and banks receive reports from dozens of entities every quarter — as PDF, Excel and slide decks, each with its own formats, definitions and chart of accounts. Summa reads them, merges the KPIs through a shared ontology and makes them comparable — without retyping.
Live data, measurable impact
One company, live ERP, accounting and inventory data, five to ten questions defined up front: Where does stock tie up cash? Which receivables are tipping? Which safety stocks are too high? Which quotes are left untouched? Granalis observes, explains, recommends — and measures the effect.
The outside world meets your model.
News, weather, geo events, market prices, sanctions lists, ship and flight movements from open sources — Granalis connects external real-time signals with your enterprise model. A storm in the Bay of Bengal becomes Monday’s question: which three suppliers are affected, and what does that mean for the orders in week 40?
Weather, ports, routes — disruptions become visible before the delivery fails to arrive.
Price indices, news situations, competitors — movements meet your terms and your stock.
Sanctions, insolvencies, geo events — hits on your portfolio become alerts with evidence.
Open and licensed sources; your data stays yours. No personal profiles, no surveillance — events and markets, not people.
Every analysis makes the next one better.
Granalis connects what usually stays apart: the situation, the analysis, the recommendation, the implemented action — and the measured result. With every engagement, this chain sharpens the picture of which actions work under which conditions. After the first analysis, Granalis knows a state. After years, it knows patterns, causes and benchmarks.
Your data stays in your instance — what grows across the platform are anonymized patterns and benchmarks.
DATA FLYWHEEL
The question is not whether your data can support better decisions — but when you start measuring their impact.
The first step is a pilot — not a platform project.
We start with one use case, real data and metrics agreed in advance. You see what Granalis detects in your own company — before you commit.
- Bounded scope: one case, defined data sources, a clear timeframe
- No infrastructure project: exports from ERP, accounting or CRM plus your documents are enough to start — days, not months
- Measurable, not a demo: before/after KPIs are agreed up front, not explained afterwards